We’re excited to announce the Webhook Dashboard release, now available on the customer dashboard at accounts.termii.com.
A webhook is a software architecture approach that allows applications to submit a web-based notification in real time to other applications whenever a specific event occurs. In simpler terms, a webhook delivers data to other applications as it happens, meaning you get notified immediately after an activity occurs.
Without proper monitoring of your webhook processing system, it can be challenging to investigate performance bottlenecks, which frustrates the resolution process.
The Webhook Dashboard is a significant update on every Termii customer account to provide a robust coverage on webhook/API activities, as part of our continuous goal to make communication and verification seamless between businesses and customers.
“Every company wants to ensure that their delivery rates are high, and we are already giving companies the ability to get real-time updates on their delivery status via their Webhooks. We have gone the extra mile to give these companies more insight into how their webhook events perform per time. The webhook dashboard will help businesses debug delivery issues faster.”— Ayomide Awe, CTO at Termii
The dashboard comes with a rich feature set providing developers with the necessary tools for deeper insights into how their webhook events are performing per time, such as:
Robust Insight on your Dashboard
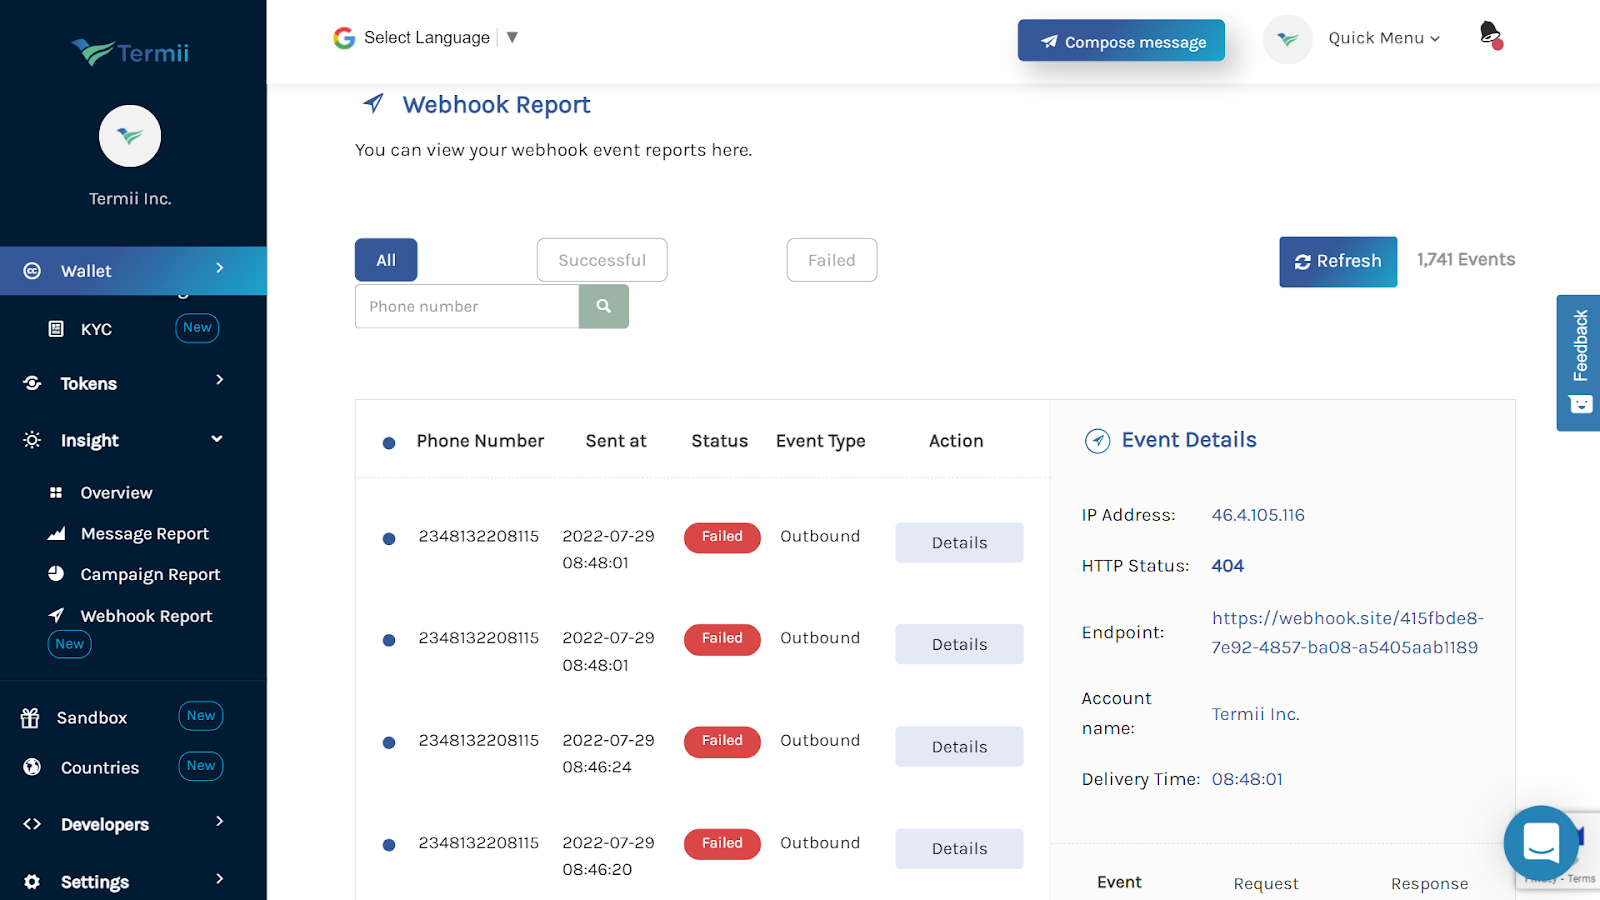
Customers can now view comprehensive insights on the time-stamp a Webhook event (notification) was performed and the status of each webhook report: Failed, Successful or All.
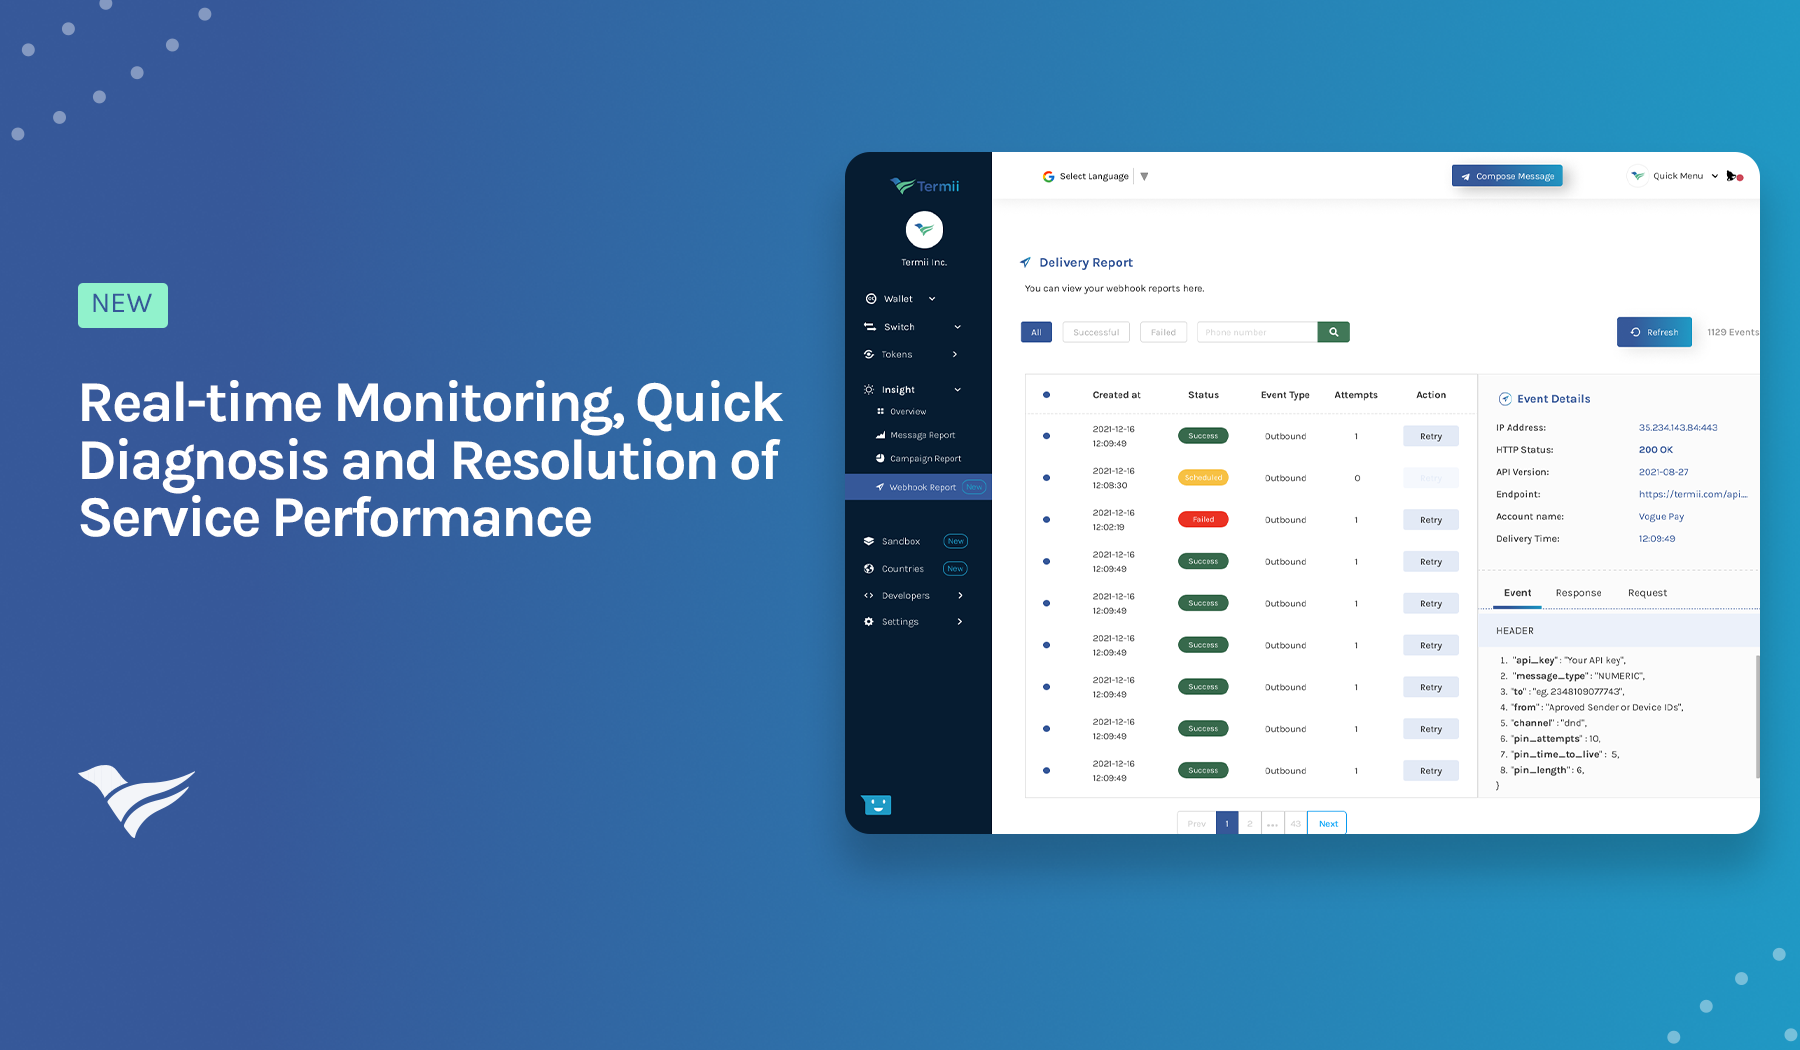
Real-time Monitoring of Webhook Events
View the total number of API events, their status and further information on; IP address, HTTP status, Endpoint, Account Name, Event, Request and Response.
Quick Diagnosis and Resolution of Service Performance
Resolving issues or inquiries when using our API products can now be carried out first-hand by our customers. Now, you can leverage webhook URLs’ coverage to detect/identify and troubleshoot problems.
More Practical Uses of the Webhook Dashboard?
- View Total Events: Users can view the total number of API events on their accounts.
- Phone Number: The user can view the activity of each phone number an SMS was terminated on.
- Sent at: Users can view the time-stamp a Webhook event was performed.
- Status: Users can view the status of each webhook report as either Failed, Successful and so on.
- Event Type: Users can view event types either Inbound or Outbound.
- Action: Users can view event details; IP address, HTTP status, Endpoint, Account Name, Event, Request and Response.
Now you are all set to checkout and explore the new Webhook dashboard here, and follow these steps:
- On the left-top of the sidebar, click on "Insights"
- Select "Webhook Report"
- Customers can proceed to explore total webhook events, actions and their status.
We'll love to hear about your experience with this new feature!